-
Call Us:1.800.561.4019
Newsletter
For a Free Quote...
Latest Blog Posts
Blog Categories
Telnet Networks News
Using Wireshark & Observer For Complete Visibility
 If you are like the average network professional, Wireshark is probably a part of your regular troubleshooting arsenal. And, why not? It's the tool by which you learned network analysis. Its flexibility in licensing, no-cost download, and familiarity, make it a logical choice to deploy to capture and analyze packets. But, what might your network team be missing, if it depends solely on Wireshark for network monitoring?
We'll look at a two-solution approach that involves using Wireshark with the Observer Platform to:
- Establish complete visibility
- Effectively reduce mean time to resolution (MTTR)
- Shift to proactive performance monitoring to reduce user complaints
Complete Visibility
Strategically using Wireshark in conjunction with the Observer Platform allows you to achieve maximum visibility and capture all the packets.
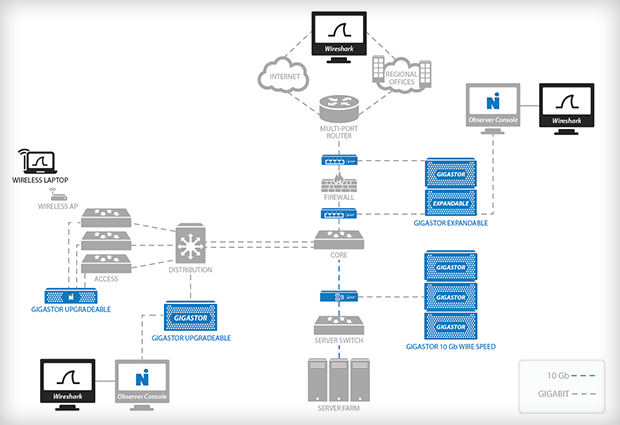
Wireshark: Deploy Wireshark at the edge for cost-effective visibility into remote offices or on an ad-hoc basis to user stations. It's no-cost licensing makes it well suited for these locations.
Observer Platform: Monitoring multiple critical applications running on a 10 Gb or 40 Gb link in the core begs the question, "Can a software analyzer handle the load?" Realistically, the answer is no. You could attempt to apply multiple filters to reduce the amount of traffic captured. But, to effectively troubleshoot issues like contention requires all the packets. The best way to ensure availability of applications in the core is through implementing hardware analysis appliances like GigaStor that can handle these speeds.
As the following network diagram illustrates, to achieve comprehensive visibility, the Observer Platform is deployed in the core and Wireshark at the edge.

Reducing MTTR
Get to the root cause of the problem quicker by supplementing Wireshark workflows with the aggregated performance views and expanded application insight from the Observer Platform.
Wireshark: Being familiar with Wireshark means you're proficient in navigating through the interface. In cases where you prefer to use Wireshark for analysis, Observer and GigaStor offer easy exporting of capture files to support this.
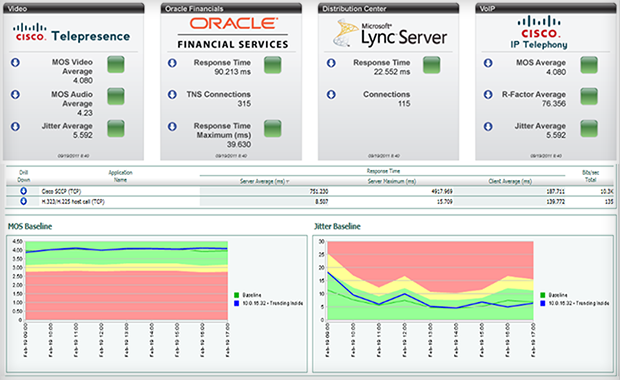
Observer Platform: Assess the scope and severity of problems in real time with high-level aggregated views, and more appropriately scale your response to the problem. From these widgets, you can also get a sense of the underlying causes of poor performance, before beginning the troubleshooting process. For example, the Cisco IP Telephony widget shows the tracking of jitter. You can also track other VoIP-specific metrics like bursts and gaps.

Additionally, Observer provides in-depth, transaction-level analysis on a variety of protocols compared to the few protocols Wireshark supports. This bolsters your ability to pinpoint what's going wrong within the application.
Proactive Performance Monitoring
Get ahead of problems by using behavior analytics and alerts within Observer to understand the normal behavior of your network and to be notified of degrading performance. Use Wireshark for snapshots of typical traffic patterns at the edge.
Wireshark: Get a sense of typical network utilization and behavior in remote offices by using Wireshark features like the Protocol Hierarchy Statistics Window. Although it's a more manual process, it's great insight.
Observer Platform: Leverage trending in Observer or Observer Reporting Server's automated baselining to determine normal performance in the core. Alerts can then be configured to notify your team of performance deviations before it impacts users.
Using this two-solution approach in managing performance provides your network team with the added visibility and insight to cut troubleshooting times, reduce the number of user complaints, and proactively ensure network and application success.
Thanks to Network Instruments for the article.
When you subscribe to the blog, we will send you an e-mail when there are new updates on the site so you wouldn't miss them.


Comments