Identify network latency bottlenecks by using empirical data directly measured against live network application traffic.
Network latency plays a fundamental and direct role in the degradation of end-user network application performance. This is especially true for audio and video delivery, bandwidth-sensitive mobile applications, cloud computing, and storage services applications. The deployment of complex security devices also contributes to the latency problem. While these devices are critical to protecting our networks, how are they impacting your network performance? Operations and security teams need complete traffic visibility to garner insights of all the devices contributing to slower network performance. Aukua Systems and Garland Technology have developed a solution to gain complete packetlevel visibility and precisely measure one-way latency between two points for every network application.

HOW IT WORKS
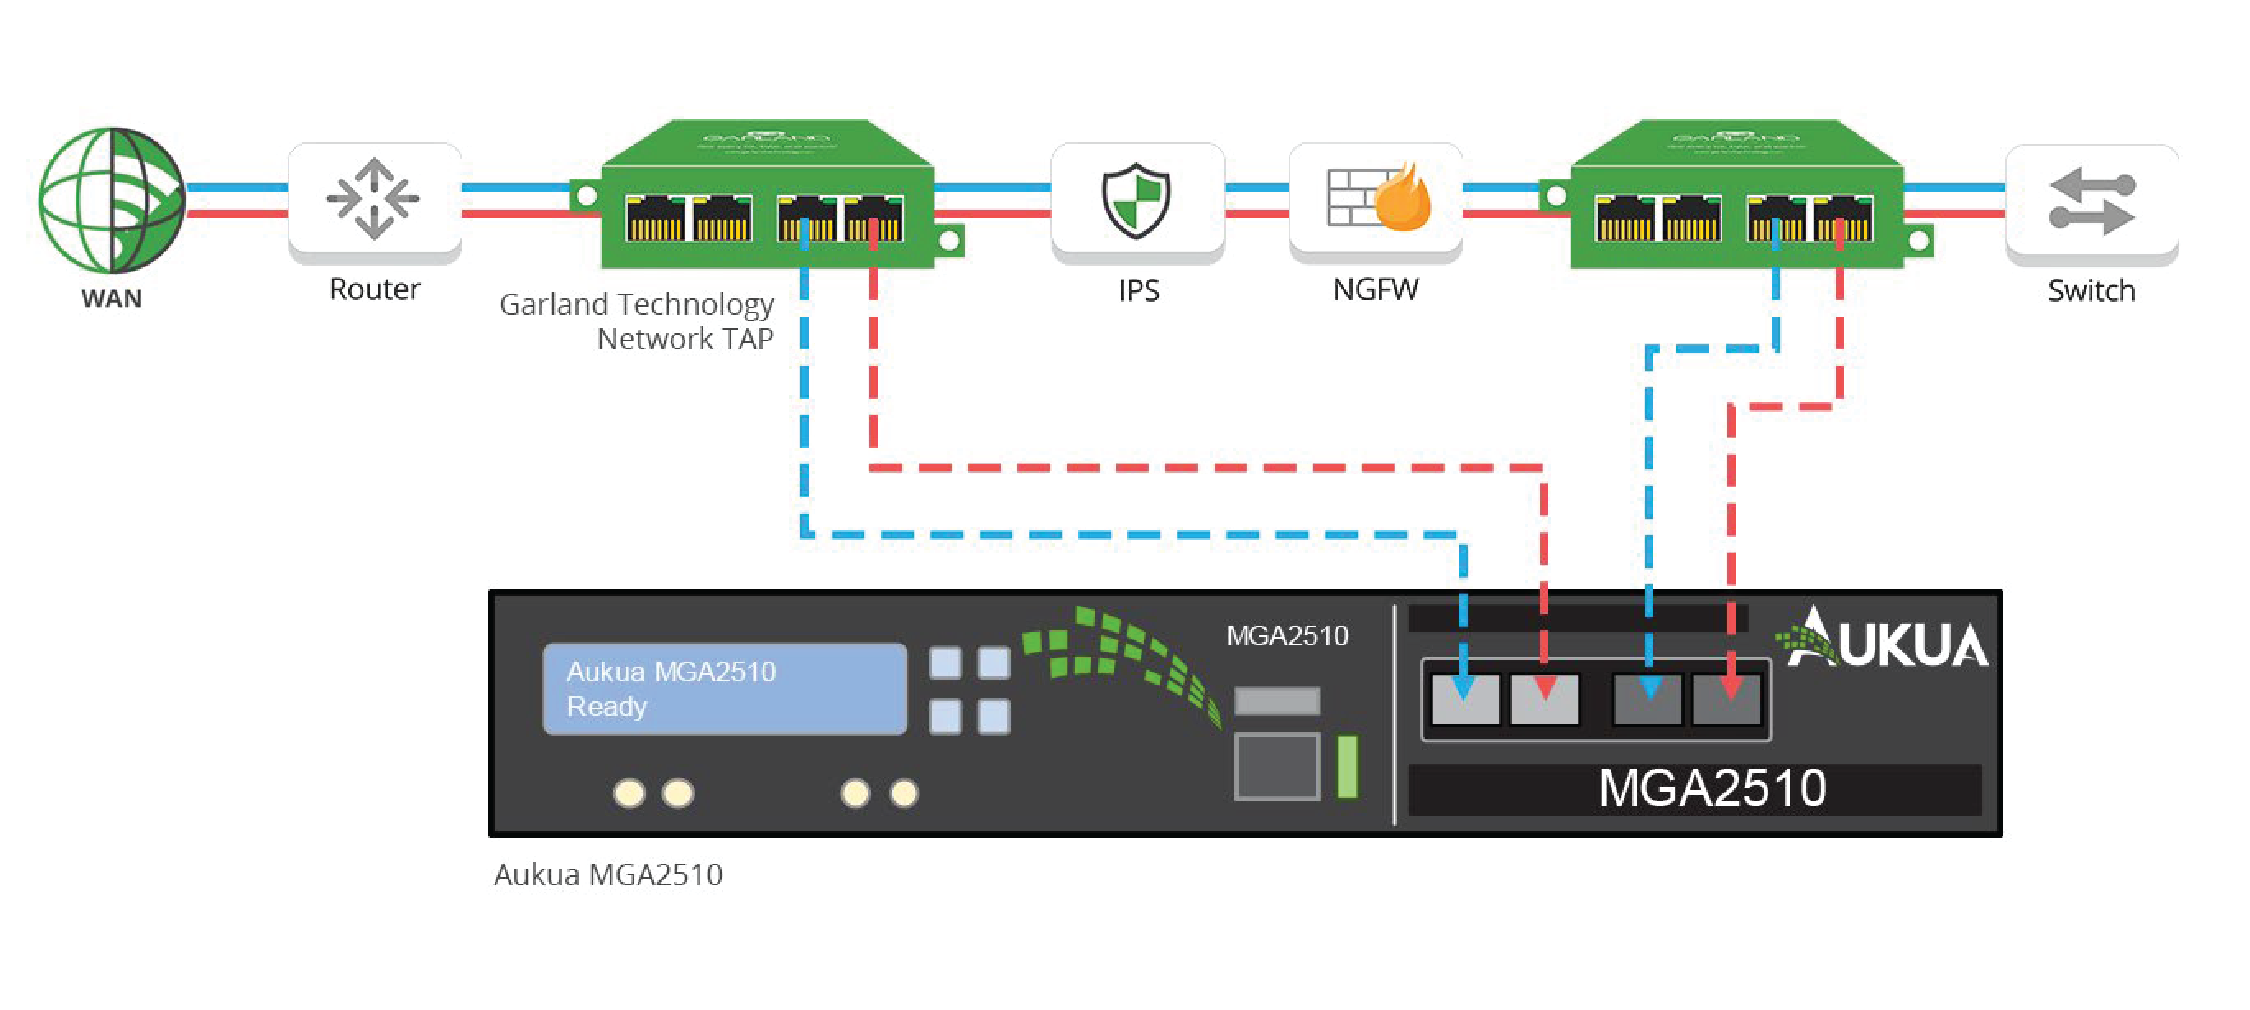
- 1. Taking in packets from both on premise and hybrid cloud environments, Garland Technology network TAPs reliably
provide complete packet-level traffic from each point of the network. - The traffic is delivered passively to the Aukua MGA2510 Latency Monitor Analyzer for analysis.
Integration Benefits
Traditional approaches to measuring network latency rely on indirect methods such as pings (ICMP) or require injecting additional foreign traffic onto a network. These methods are not accurate and provide little to no information on how some applications are impacted differently from others. In many cases, they can violate regulatory or procedural requirements. Leveraging Garland Technology TAPs, live network data is duplicated with no latency added, supplying out-of-band traffic to Aukua’s MGA2510 Latency Monitoring Analyzer. The 100% visibility enables the Aukua solution full monitoring and direct analysis of network application traffic without introducing extra packets into the network.
Security and Network Operations Team Benefits
- Ensure zero dropped packets to all critical tools with complete network visibility by passing all live wire data
- Full visibility across on-premise, private, public, or multi-cloud environments
- Reliable traffic aggregation, load balancing, and filtering – full control over traffic behavior and flexibility for
aggregation and regeneration - Measures one-way latency directly experienced by application or production traffic with 1.0ns precision
- Passive deployment - no need to introduce extra unwanted traffic into the network (such as with ICMP
or active probes) - Allows you to stay compliant with regulatory requirements while improving the accuracy of latency measurements
- Leverage a powerful and customizable set of L2 - L7 filters and triggers to configure which applications, devices,
addresses or protocols to monitor or capture - Real-time stats and graphical analysis including latency histogram, custom bandwidth stats, and packet size distribution


