-
Call Us:1.800.561.4019
Newsletter
For a Free Quote...
Latest Blog Posts
Blog Categories
Telnet Networks News
Observer Infrastructure: Adding The Device Performance Perspective
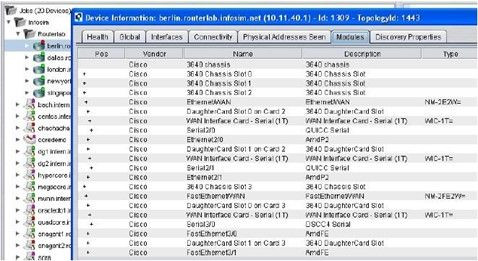
 In April 2010, Network Instruments® announced the availability of Observer Infrastructure (OI), an integral element of their Observer® performance management solution, which complements their primary packet-oriented network and application performance monitoring products with an infrastructure viewpoint. An evolutionary replacement for Network Instruments Link Analyst™, OI has been significantly expanded and includes network infrastructure device health monitoring, IP SLA active testing, NBAR and WAAS data collection, and server monitoring. These new performance data sources are tightly integrated into a common console and reporting engine, Observer Reporting Server, providing quick and efficient workflows for navigating between packet and polling realms.
Issues
As network technologies have matured and architectural redundancies have improved availability, the focus of networking professionals has turned toward performance and optimization. Along with that shift comes a change in the types of issues demanding attention (away from failures and towards degradations) plus a change in scope (away from network device specifics and towards application and service awareness). Network performance management is the discipline of planning, monitoring, and managing networks to assure that they are delivering the applications and services which customers and end users consume and which underpin business processes. A high-performing network, managed in a way which is business-aware, can become a strategic asset to businesses of all sizes and purposes, and hence operations must also move from reactive firefighting of performance issues towards proactive prevention via methodical and vigilant monitoring and analysis.
Network performance management has been an active area of practice for decades. Initial efforts were focused primarily on the health and activity of each individual network device, mostly using SNMP MIBs, both proprietary and standardized, collected by periodic polling. This approach was supplemented by now-obsolete standards such as RMON for providing views into traffic statistics on an application-by-application basis. Today, additional techniques have been established for measuring various aspects of network performance and are used broadly today:
- Synthetic agents provide samples and tests of network throughput and efficiency
- Direct-attached probes inspect packets to track and illuminate performance across the entire stack
- Flow records issued by network infrastructure devices record traffic details
So which one is the best? And which ones are important in order to achieve best practices for businessaware, proactive performance management? In the end, no single method meets all the needs. The best approach is to integrate multiple techniques and viewpoints into a common operational monitoring and management platform.
Building the Complete Performance Management Picture
Making the transition from reactive to proactive and from tactical to strategic in the long term requires the assembly of a complete performance management picture. And as with any journey, there are options for where to start and how to get there. Most practitioners start with a focus on the network infrastructure devices by adding basic health monitoring to their fault/event/alert regime, but find it insufficient for troubleshooting. Others will deploy packet monitoring, which provides application awareness together with network-layer details and definitive troubleshooting, but find that collecting packets everywhere is difficult to achieve. Still others will look to NetFlow to give them insights into network activity, or perhaps deploy synthetic agents to give them the 24x7 coverage for assuring critical applications or services, but these approaches have their shortcomings as well.
Where you start may not be as important as where you end up. Each measurement technique has something important to add to the operations picture:
- SNMP and/or WMI polling gives you details about the specific health and activity within an individual network device or node – important for device-specific troubleshooting and for capacity planning.
- SNMP can also be used to gather specific flow-oriented performance metrics from devices that offer application recognition for optimization and security, such as Cisco’s WAAS (Wide Area Application Services) solution and NBAR (Network-Based Application Recognition) features.
- Agent-based active or synthetic testing, such as the IP SLA features resident in Cisco network devices, enables regular/systematic assessment of network responsiveness as well as application performance and VoIP quality.
- Packet inspection, either real-time or historical/forensic, is the ultimate source of detail and truth, revealing traffic volumes and quality of delivery across all layers of the delivery stack, and is indispensible for sorting out the really tough/subtle/intermittent degradation issues.
- NetFlow (or other similar flow record formats) provides application activity data where direct packet instrumentation is not available/practical.
Ultimately, the better integrated these data sources and types, the more powerful the solution. Integration must take place at multiple levels as well. At the presentation/analysis layer, bringing together multiple types of performance data improves visibility in terms of both breadth and depth. At the data/model layer, integration allows efficient workflows, and more intelligent (and even automated) analysis by revealing trends, dependencies, and patterns of indicators that must otherwise be reconciled manually.
Network Instruments Observer Infrastructure
Network Instruments has introduced Observer Infrastructure (OI) to extend their network and application performance management solution by tightly integrating device-based performance data at both the data and presentation layers. OI adds the infrastructure performance perspective to the packetbased and NetFlow-based capabilities of the existing Observer Solution. It also contributes IP SLA support as well as support for other complementary SNMP-gathered data sets, such as Cisco’s NBAR and WAAS features. OI goes further, delivering visibility into virtualized servers via WMI, at both the virtual machine and hypervisor levels. Another new capability is OI’s support for distributed polling and collection, allowing the infrastructure perspective to be applied across large, distributed managed environments.
Key implications of the newly enhanced Observer Infrastructure solution include:
- Faster, more effective troubleshooting via complementary viewpoints of performance within enabling or connected infrastructure elements.
- Better planning capabilities, allowing engineers to match capacity trends with specific details of underlying traffic contributors and drivers.
- More proactive stance, by leveraging synthetic IP SLA tests to assess delivery quality and integrity on a sustained basis.
- Improved scalability of the total Observer Solution, via the newly distributed OI architecture
EMA Perspective
ENTERPRISE MANAGEMENT ASSOCIATES® (EMA™) analysts strongly advocate the use of a broad and balanced approach to network and application performance management, drawing from the unique and valuable contributions of several types of performance monitoring instrumentation strategies. In parallel, data from such hybrid monitoring architectures must be integrated into presentation and workflows in a way that it can facilitate operational. efficiency and effectiveness and pave the way to proactive practices.
Network Instruments has a well-established footprint in packet-based solutions and substantial experience with infrastructure monitoring. The newly released Observer Infrastructure is an evolutionary product based on stable, long-fielded technologies which has been expanded in functionality and also has been more tightly integrated with the rest of the Network Instruments Observer solution, including presentation through Observer Reporting Server and workflow links to GigaStor™. The result is a powerful expansion to the Observer solution, both for existing customers as well as any network engineering and operations team looking for a comprehensive, holistic approach to network and application performance management.
Thanks to Network Instruments for the article.
When you subscribe to the blog, we will send you an e-mail when there are new updates on the site so you wouldn't miss them.


Comments