-
Call Us:1.800.561.4019
Newsletter
For a Free Quote...
Latest Blog Posts
Blog Categories
Telnet Networks News
Latency vs. Jitter: Monitoring network performance
Jitter and latency are critical parameters in assessing and maintaining network performance. Network engineers need to be able to distinguish between them when optimizing network performance.
Latency, the delay in data transmission, directly affects user experience, application responsiveness, and data transfer efficiency.
Jitter is the variation in the delay of packet arrival times. This variation adds a layer of complexity by introducing irregularities in the delivery of data packets.
Types of network latency
- Propagation Latency: The time it takes for a signal to travel from the sender to the receiver.
- Processing Latency: The time it takes for a networking device to process a received packet and determine where to send it next.
- Queuing Latency: The time a packet spends waiting in a queue before it can be processed.
- Serialization Latency: The time it takes for a packet to be converted into a series of bits for transmission.
Understanding the nuances of latency and jitter and employing the right measurement tools are crucial for effective troubleshooting. You can implement targeted optimizations by identifying the specific latency type causing issues, enhancing overall network performance and user experience.
Integrating these measurements into routine monitoring practices ensures a proactive approach to latency management and network optimization.
Impact on network performance
Latency influences the responsiveness of applications and directly affects user perception. High latency can lead to delays in data transfer and increased lag in real-time applications, impacting overall user satisfaction. On the other hand, Jitter can result in inconsistent communication between devices, leading to packet loss, degraded voice and video quality, and disrupted data flow.
Consider scenarios where latency becomes critical, such as in online gaming or video conferencing, where real-time interaction is essential. Jitter issues may arise in voice-over-IP (VoIP) calls, causing voice distortions or dropouts. These real-world examples highlight the tangible impact of latency and Jitter on user experience and application performance.
Methodologies and tools
Network engineers commonly use tools like ping, traceroute, and network analyzers to measure latency. Metrics such as Round-Trip Time (RTT) and one-way delay are crucial for assessing latency. As a dynamic metric, Jitter is often measured using Mean Opinion Score (MOS) for voice quality or tools that analyze packet arrival times.
Engineers analyze network infrastructure when troubleshooting latency, identifying potential bottlenecks, and optimizing routing paths. Jitter troubleshooting involves packet loss analysis and, if necessary, implementing Quality of Service (QoS) mechanisms to prioritize real-time traffic.
Mitigation and optimization
Latency can be optimized by implementing traffic shaping, caching, and load balancing techniques. For example, network packet brokers are an excellent solution for optimizing traffic flow.
Jitter mitigation involves buffering and packet reordering mechanisms. Additionally, network engineers should prioritize bandwidth management, ensure efficient routing, and proactively monitor network health to optimize overall performance.
It's also good to keep an eye on the tools you use themselves. Every device you add, adds latency. Profitap network TAPs are designed for optimal performance and have a fixed low latency that you can account for. This means you won't introduce new variables into your system that make troubleshooting harder.
Analyzing latency and jitter issues
Latency issues can happen randomly, so it's a good practice to have network monitoring tools to help you monitor latency and jitter issues as soon as they pop up.
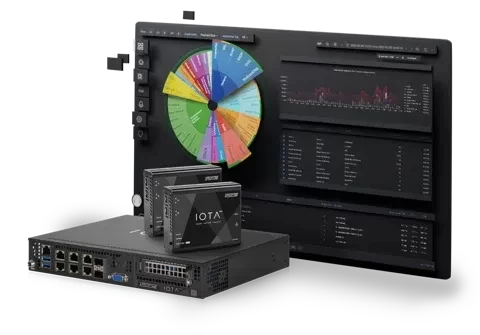
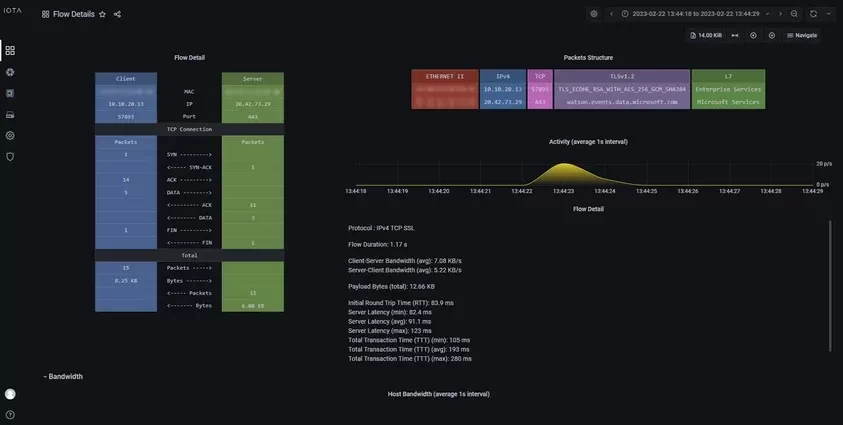
Profitap aims to make troubleshooting network performance as easy as possible with the IOTA All-In-One Network Traffic Monitoring Solution. IOTA is a powerful network capture and analysis solution for edge and core networks. The IOTA lineup consists of portable EDGE models, high-speed CORE models, and the IOTA CM centralized device management system.
The IOTA solution provides fast and efficient network analysis and troubleshooting capabilities to branch offices, SME businesses, and core networks, such as data centers.
IOTA allows you to capture network traffic without affecting network performance or security and gives detailed real-time and historical network traffic visibility into critical applications and data.
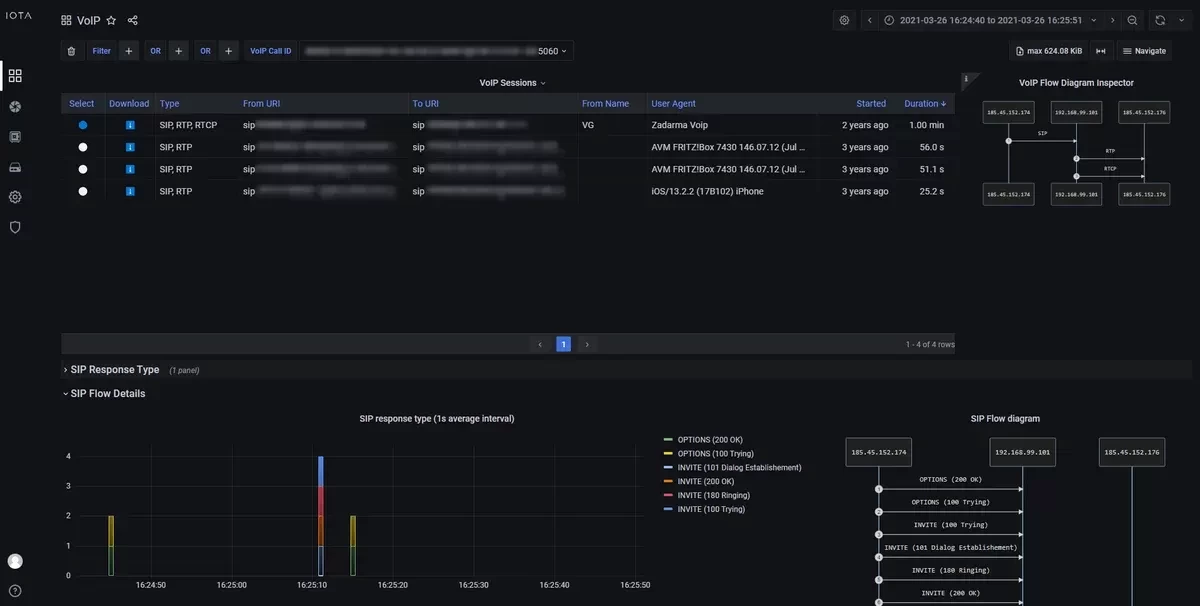
With specialized dashboards, such as the VoIP dashboard, you instantly get an overview of SIP and RTP metrics and MOS scores. Learn more about troubleshooting VoIP on our Knowledge Base.
Good to know:
Understanding the differences between Jitter and latency is fundamental for effective network management. Network engineers should prioritize a holistic approach, combining proactive monitoring, strategic infrastructure optimization, and rapid troubleshooting to ensure optimal network performance.
Addressing latency and Jitter issues can enhance user experience, application responsiveness, and the network's overall efficiency. Profitap IOTA is a valuable asset in the network engineers' toolbox for these types of network analysis.
When you subscribe to the blog, we will send you an e-mail when there are new updates on the site so you wouldn't miss them.



Comments